Geez, yesterday’s request brought in some wonderful feedback about charting programs, not to mention some good material for future Panbo entries and even a candidate for my Helm Shot column (if he’s not too shy). This blog is helping me with my day job as a magazine writer, and it’s a delight to make contact with such interesting readers. But what really tickles me is that Panbo may play a small role in improving marine electronics and software. The latest evidence is the way RosePoint modified Coastal Explorer so that ENCs will always display those rocks we’ve been worrying about lately (even though, for reasons unknown, that’s contrary to the ECDIS standard). Gregg from RosePoint exclaimed the issue nicely in comments yesterday, and later a reader pointed me to a thread at Trawlers-and-Trawling which suggests that the customer who motivated RosePoint referenced Panbo. At any rate, hat’s off to RosePoint for responding with amazing speed.
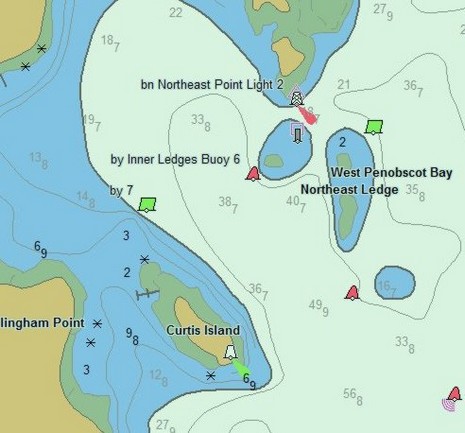
And so let’s complain when we see a problem. Below, for instance, is Fugawi’s ENC display of Camden Harbor. Fugawi already has the rocks right; no matter what display options you pick (full screen shot here), you can not make them disappear. But, damn, why can’t they get the depth soundings right? What is 9subscript8 feet anyway? 9’8” or 9 and 8/10ths feet? And who cares…10 is what the original says and that will do just fine. These messed up soundings take up precious screen room and confuse the eye and brain (and I’ve seen the same problem on other vector chart displays).
PS. I’m aware that all charts will supposedly go metric eventually, and that the underlying soundings in the ENCs may already be in metric, but note how some ENC screens below display feet in nice natural numbers.
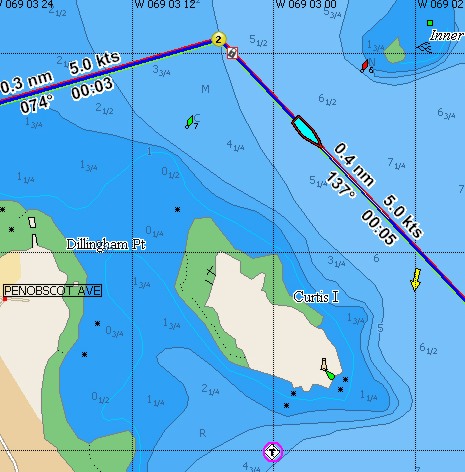
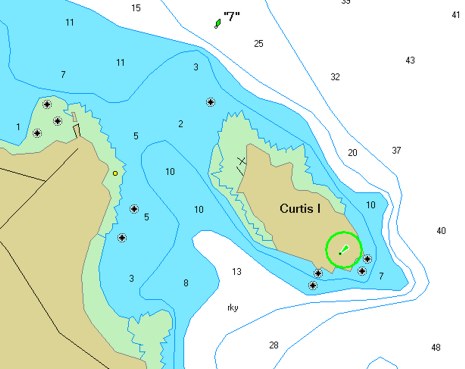
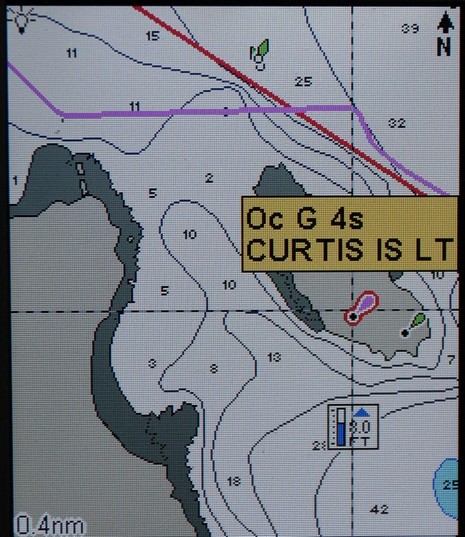
NavSim sent me a screenshot (above, and full size here ) from its latest BoatCruiser software, which now supports C-Map Max charts…and there—unlike the shot I put up yesterday—is the Curtis Island light. That got me investigating. I discovered that if I zoomed in tighter in PC Planner the light suddenly appears. So it is there in the data, though it certainly should appear in the zoom level I showed and in even larger area zooms. I also found a picture of the same Max card being used in a Standard Horizon plotter last summer (below), and the light is showing. I don’t have a C-Map compatible plotter here to see if disappears inappropriately as you zoom out. It’s nice, by the way, to be reminded of those tracks I made last season.
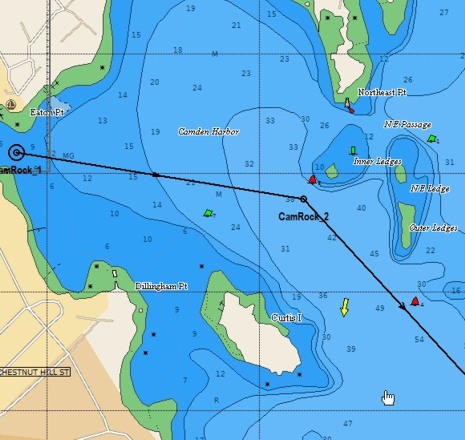
Geez, I’ve got companies (and individuals) sending me screenshots to prove that their charts show the rocks in my harbor! That’s Garmin BlueChart on a PC above. You’ll notice it’s based on the 1:20,000 harbor chart, like the NauticPath I first showed, only the obstructions are clearly marked. (Garmin seems particularly big on this obstruction symbol, keeping them onscreen even as you zoom out). More good news: the rocks also show clearly on Navionics’ and C-Map’s vector charts, and on NOAA ENCs as displayed by Nobeltec and Fugawi, neither of which will even let you turn them off. Dennis Mills, developer of the very able Capn, told me the reason that some software, including his, can turn off the rocks is screwy but official S57/ENC object prioritization. But then, doh!, I discovered that the Capn is not showing the obstructions that cover symbol on at least some of the SoftChart style ENCs it uses, even when in the well-described “Full Navigation Info” mode. Mills was surprised, blamed the software they use to create the ENCs from the NOAA raw data, and signed off “we’re working on it!” I think MacENC is also working on making its rock display more conventional.
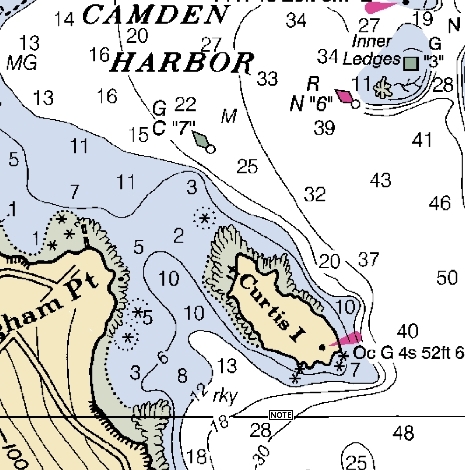
At any rate, I think we should all take a careful look at the different electronic chart types we use, perhaps especially the ENCs. Look hard, and send me examples of important details that are missing or badly presented. I doubt that anyone is tracing the paper charts perfectly, and even the paper charts have errors. For more inspiration, check out this C-Map Max image of Camden Harbor. It’s one of the nicest vector displays I’ve seen, and the rocks are right…but where the hell is the Curtis Island Light, the biggest navigation aid in the area? Doh! Have a nice weekend, but don’t completely trust any chart.
Panbo friend Jeffrey Siegel sent over an excellent example of how important those chart asterisks can be. His raster chart clip above “shows a very nasty rock just outside Castine that is exposed by two feet at low tide (and thereby lurking just out of sight for most of the day). I know of 10 boats that have hit this rock - one guy even installed a pole on it after hitting it because he was so angry (it has since fallen off). It would be completely unacceptable to have that rock missing on any chart.” Well, I’m sorry to report that this “obstruction that covers” (official NOAA designation) is completely missing from the NauticPath charts I’m testing. Query the area with the cursor and it shows a minimum depth of 12’. Not good!
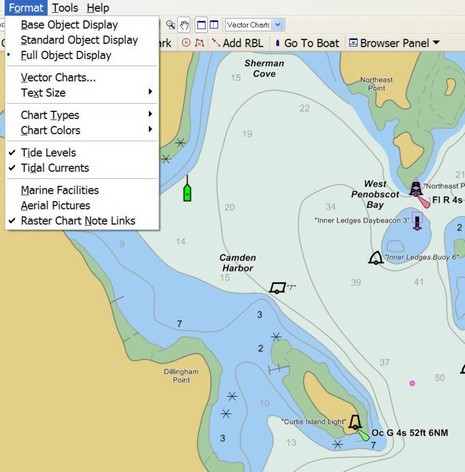
Moreover I’ve come to realize that NOAA’s own ENC vector format can be a little dicey about showing these same obstructions. There is no detailed ENC for Castine yet, but when I open the Camden 1:40,000 chart in Chart Navigator Pro (aka Coastal Explorer), the obstructions only show if I’ve set the ENC format to “Full Object Display”.
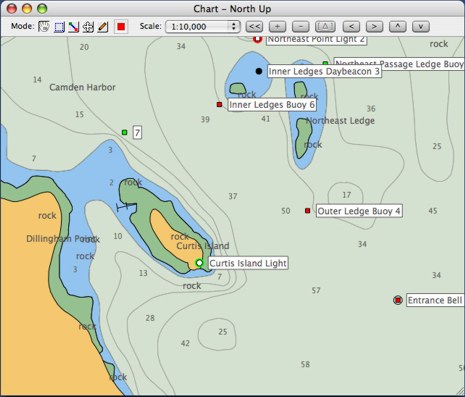
Then there’s MacENC, whose developer has for some reason chosen to show the obstructions by writing out “rock” instead of using the common symbol. I find that confusing as such words usually describe bottom composition, plus the point location of the rock is lost. At any rate, I’m going to check out how some other programs display the ENCs, and how other vector formats handle the obstructions, but right now I’m feeling very fond of familiar raster charts!
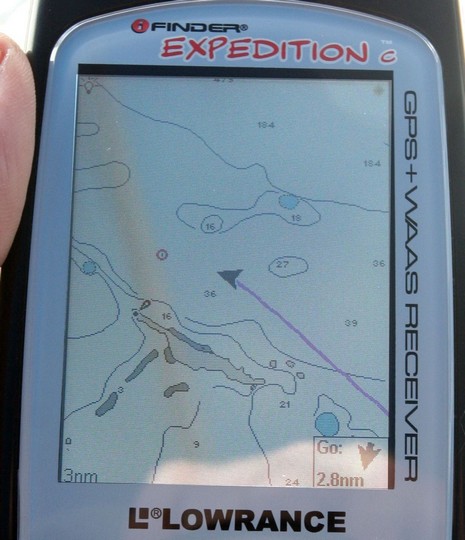
I’ve done more testing of the Lowrance ExplorerC handheld, and still like it a lot, but there are some real issues with the NauticPath charts. The main one is the absence of “obstructions that sometimes cover/uncover”, i.e. the damn rocks marked with asterisks on the paper chart below! Compare the two charts—soundings, bathy lines, high and low tide shore lines are all exactly the same…but rocks that may be just below the surface at any tide have vanished from the NauticPath (though I’m quite sure they were in the original Transas chart database). Those asterisk symbols are critical information, and they seem to be missing from NauticPath wherever I look around the country. The same is true on the LCX-111C downstairs, with a different copy of NauticPath on its hard drive, though on that machine the aids to navigation do not show double as they do on the Explorer (above). At any rate, I dare say the folks at Lowrance may be a little distracted right now, but I am going ask if they intend to put the rocks back in NauticPath.
Above is the NauticPath version of Abaco (right around Whale Cay), not any better detailed than the boat’s older Navionics charts, but a bit easier to understand in color, even on a handheld. NauticPath uses the same Transas chart database that Garmin BlueCharts and Nobeltec Passport charts are based on, but both of the latter have upgraded to private data for the Bahamas. Still, Lowrance’s charts are useful, and an incredible value. You see the little $109 NauticPath chip in this handheld includes not just the Bahamas but the entire U.S. coast including AK, HI, and the Great Lakes. That really got the attention of my two shipmates, each of whom had a Garmin 76C. Which, of course, is a very good handheld, but charts for it have gotten quite expensive compared to Lowrance and others like Navionics Silver. (I wonder if Garmin will lower BlueChart prices for existing models?)
Lowrance’s handheld (bigger here) is a hell of a deal too. This is the new Expedition C, $309 retail with a 2.8” transflective screen and built-in electronic compass and barometric altimeter (with weather predictions). It will even play MP3 music files, though I don’t think you can do that and still use the NauticPath SD card as there is only one card slot. The screen is quite readable in all conditions, though I wish there was more than one level of backlighting to save batteries, and night vision, when it’s really dark. The unit is fast and its WAAS GPS performance is extraordinary, able to quickly and easily acquire a 3D position with just a plane window sky view. In short, about $400 gets you a pocket plotter ready to use anywhere in the U.S. and Bahamas. Amazing.
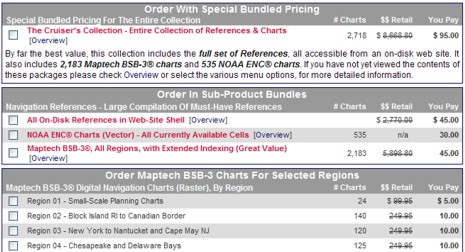
Oy, while I’m sleeping, a comments war breaks out over cheap charts (here and here). The main issue seems to be whether or not Maptech and NOAA’s free download sites are offering the same sets of raster charts, and therefore whether or not the various repackaging operations are offering the same chart DVDs. I don’t yet know the truth, but I am very dubious that Maptech is serving up a 1,000 more charts than NOAA is. Especially since the main source of this info seems to be a dubious site called FreeNavCharts.com. FreeNavCharts is offering a good service, and has lots of correct info about electronic charts, but, man, is it hyped up! Does a simple region of raster charts really have a retail value of $249.95, as suggested above? Hell no! Even when Maptech did sell $250 Digital ChartKit regions—before NOAA changed its chart policies—the package included much, much more than just the raster charts. And I’m afraid it gets worse at FreeNavCharts:
“It's interesting to note that Maptech still sells the BSB-3 charts in a collection called Chart Navigator Pro for $499.95. The 'Chart Navigator Pro' collection includes 13 DVDs. While this sounds like a lot larger collection, they fail to tell you that all of the BSB charts on the 13 DVDs could easily fit on a single DVD! They are packaged with 13 individual DVDs to liquidate leftover inventory of Regional Collections.”
I have one of the very first copies of Chart Navigator Pro (CNP) and can tell you that the charts are updated into November 2005. In other words, the “liquidate leftover inventory” line is pure bullshit. Moreover, I just opened a random CNP DVD—St. Augustine to Crystal River, Florida—and here’s what’s on it besides for the RNCs and ENCs: 1.2 GB of 3D bathymetric data, 688 MB of topo maps, 1.7 GB of photo maps, 70 MB of panoramic photos, plus tide tables, pilot books, and lots of POI’s. Of course CNP also comes with a copy of Coastal Explorer software, which makes accessing all this data very easy (and also makes FreeNavCharts’s much hyped index meaningless).
Bottom line: FreeNavCharts—like ChartsDVD.com, and I’m sure there will be lots more—is just packaging and selling stuff that anyone can download. The true retail value of the disks is quite low. Yes, repackaging is a perfectly honorable service because the downloading is a pain, but confusing consumers with hype—and especially with lies about another company’s products—is dishonorable. Here’s hoping the FreeNavCharts.com cleans up its act.
PS 1/7: As suspected, the 1,016 RNCs listed by NOAA are the same as the 2,077 RNCs listed by Maptech; it’s just a matter of whether you list, say, a 4 page small craft chart as 1 or 4 charts. My source here is Jack Webb, proprietor of FreeNavCharts, who plans to change his site to reflect this reality. Thanks, Jack!
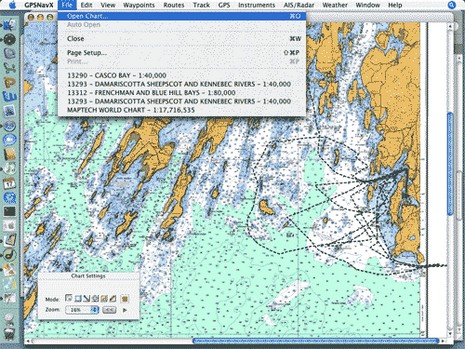
* Panbo reader Dan Hinckley has put together a thorough and useful review of his experience running both GPSNavX and MacENC on a Mac mini, which is where the screen shot above came from.
* A couple of readers have pointed out www.chartsdvd.com, which is the work of a sailing couple living in San Francisco. They’re offering all of NOAA’s free raster and vector charts on one DVD for $30, shipping included, nice and simple.
* At the other extreme of computer charting is WECDIS, the Warfare version of Electronic Chart Display and Information Systems. Slowly but surely the world’s navies are dumping paper charts in favor of WECDIS, or similar systems with different acronyms. The company supplying the British Royal Navy and hoping to get the U.S. business is OSI.
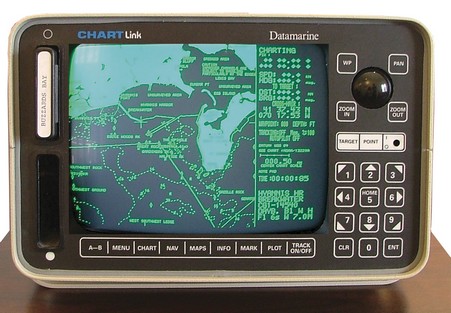
C-Map owns this ‘historic’ machine, which is supposedly the first chart plotter (bigger here) ever sold in the U.S. That was around 1985, when Navionics founders Giuseppe Carnevali and Fosco Bianchetti developed the first crude vector charts and this Datamarine-labeled plotter to show them. (Bianchetti soon went off to found C-Map). Wasn’t it about 5 years later that the first PC charting program came out? At any rate, we’ve come a hell of long ways in 20 years, and Carnevali and Bianchetti—who still run their companies—deserve some of the credit.
Now, would anyone care to predict what marine electronics will look like in another 20 years? 10? 5? With that, I wish you all a wonderful new year.
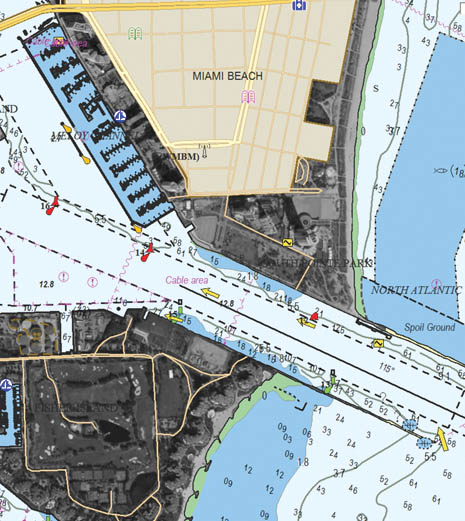
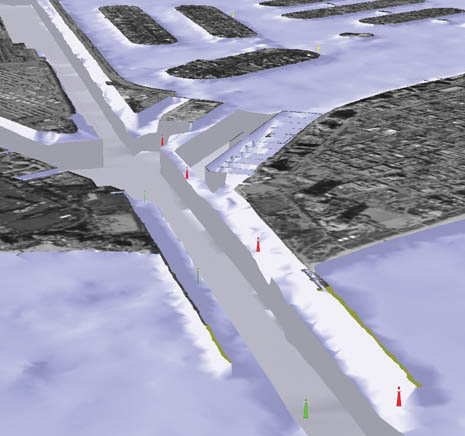
The chart game just gets more complicated, and interesting. There’s nothing on the Web yet, but last week C-Map announced the Pro version of its Max chart format. A couple of weeks ago I got a peek at it running on Northstar’s amazing new 8000i system, about which I will soon tell you a lot. One claim of C-Map is that Pro “delivers the most ‘paper chart like’ display ever seen from a vector chart.” I’m not sure how they’re doing it—new fonts, colors, object arrangement, maybe all of the above—but the charts looked really good. I didn’t get to see the photo map blending and 3D views seen above and below (in company screen shots), but look forward to at the Miami Boat Show where Pro will officially debut. Other features include “one button” chart updating and a weather overlay data system. Of course, all the regular goodies in Max are also included. Pro will be a premium product costing about $390 for 'MegaWide' areas, and so far only the 8000i supports it.