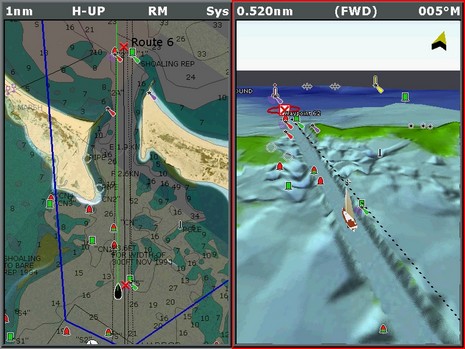
I recently took some screen shots of DAME award winner Navionics Platinum, which is surprisingly simple to do on the Raymarine E series. You just hold down the ‘data’ button until you hear a beep, and a full resolution (800x600 pixels, in the E120’s case) .bmp file will be saved to the CF card. At any rate, the full res version of the image above is here. That blue line on the left side marks the angle of view that I’ve set in the 3D image to the right. You can rotate and move around in that 3D view all you want, plus change its zoom and pitch, or you can simply synch it to the chart view.
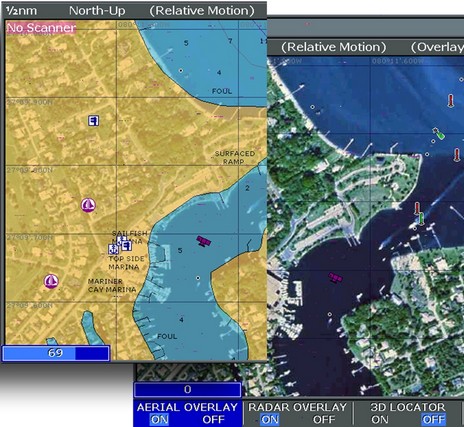
Note too how the area around the channel is much more detailed than the chart soundings; it looks like you can even see the bite marks of the dredge. Navionics, like everyone else, is pretty tight about where it sources data, but I know that the Corp of Engineers does extremely high resolution surveys during dredging projects, and I think that’s what we’re looking at. {Wrong, it turns out; after speaking with someone at Navionics I think that it’s more likely that this is just an ‘effect’ that Platinum applies to any dredged channel.} The left window, by the way, is a blend of photo map and chart, as I discussed earlier. I’ve notice unfortunately that all the photo maps north of New York State are black and white, exactly like Maptech’s, which are based on USGS files (which probably explains that source). Below (and bigger here) is an illustration I made trying to show how the variable blending works. On the right side you can see how nice the color maps can be.
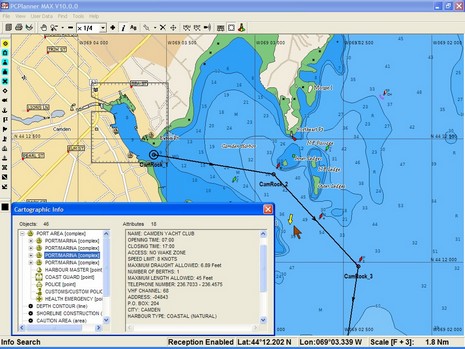
A C-Map question this morning reminded me that I’d meant to comment on my experience with the company’s latest PC Planner product. I’ve always liked the concept: bring home your chart card, stick it in Planner’s reader and use it to do fast, detailed route making on a PC, then bring the routes back to your plotter on a user card. These days Planner is a pretty mature program and also nicely shows off the goodies in C-Map's newish Max chart cards. Check out the streets, detailed harbor info, multi-shaded contours (land too), and even a yellow real time current arrow in the screen shot above (bigger here). The program can also display Max’s perspective view, animated nav lights, and harbor photos. I may have razzed C-Map last spring for its Max marketing, but I like the charts and PC Planner.
And I’ve wondered why Navionics has not yet introduced a similar product. (I have been told it was “about to happen” several times, including quite recently.) Even Garmin users can’t plan on a preprogrammed data card, though they can get the same effect by buying BlueCharts on a CD and making their own card (note that the new G2 charts will not be available on CD, at least at introduction).
At any rate, the question asked this morning was the cost for Malaysian C-Map charts for use on a PC. One reason for the long introduction is that PC charting programs supporting C-Maps can generally read them either from the CD version or from a card via the reader (SOB has a good explanation of the hows and whys here). A "Wide" size CD unlock code for the Malaysian area, either Max or regular NT+, costs about $250 and includes maybe 100 charts (you can drill down to name, scale, etc. detail using C-Map’s online catalog). I’m still working on prices for the applicable cards, which come in two possible sizes for the area; they’re likely a little higher, but can also be used in a dedicated plotter. I was surprised that I couldn’t find these prices online; I think Bluewater usually has such info but their system is down. Any suggestions for other online sources of worldwide electronic charts?
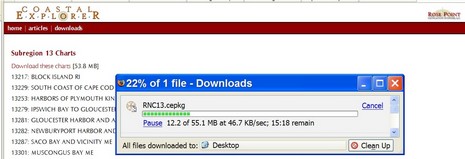
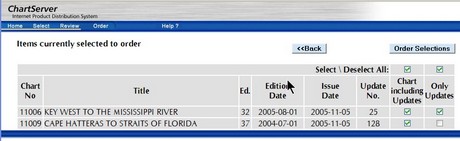
Honestly, I’m a little surprised that NOAA got its RNC ChartServer up and fully populated so soon. (And thanks to GPSNavX for the head’s up). I tried it yesterday, and here’s what I noticed:
* According to the official verbiage, NOAA RNCs (™ yet!) are considered “official” but redistributed copies are not (yet). “At a future date, NOAA intends to establish a program under which distributors may be certified to redistribute NOAA RNCs™ such that they will retain their official status and meet chart carriage regulations.”
* While the underlying charts seem to be the same, and fabulously current (updates applied through 2 weeks ago in many cases), NOAA is using different server software than Maptech’s freeboatingcharts.com. Since each site has unique ways to search for charts, there are now lots of ways to find them. NOAA zips them up for immediate downloading; freeboatingcharts sends you an email when the self-executing zip file is ready.
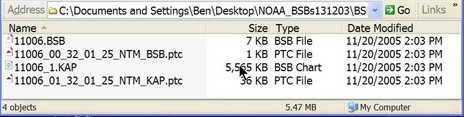
* Most interesting, I think, is that NOAA is also offering small update files that I presume will make the latest edition of a chart current. This will be great for keeping a portfolio updated, especially for those with narrow-band connections, like on a boat. But I think that the .ptc update file format only works in older Maptech software so far (not, for instance, CNP/CE, yet). Can anyone illuminate me?
The good folks who make GPSNavX and MacENC just announced a $40 (plus $5 s/h) DVD containing all NOAA U.S. coastal charts, including Alaska, Hawaii, and the Great Lakes. They’re in BSB 3 file format and should work fine with any Mac or PC charting program that reads BSBs—which is just about all of them. Note that the BSB 3 format is not encrypted. Note too that these are the same charts available for free download at freeboatingcharts.com (but what a hassel it would be to order, download, and unzip all of them).
We interrupt the normal new electronics programming for a brief rant. I just read this in the November issue of Boat.U.S., reportedly the largest circulation boating magazine on the planet (and generally quite good):
“But before you have visions of hitting ‘print’ on your computer and getting a high resolution quality chart, boaters need to understand the terms ‘raster’ and ‘vector’ charts. A raster chart is essentially a snapshot of a paper chart, composed of a bunch of dots, like a newspaper photo. While the resolution is not good enough for printing, it’s fine for a computer program and screen display.”
Say what!?! Everything printed is a bunch of dots, and the native resolution of most raster charts is 254 dots per inch, very darn close to the 300 dpi standard for quality glossy magazine images. Just about any decent charting program can print rasters very nicely at full scale (the only real trick is printing from the file, not the screen image).
The BoatU.S. article, titled “Charts Go PC”, starts with a decent explanation of NOAA’s new free RNC (and ENC) download policy. But then it veers into shaky territory like the above and various other misunderstandings about vector/plotter charts. It’s a shame because boaters are confused enough about marine electronics, software, digital charts, etc. that the “expert” magazines should be going out of their way to provide accurate information.
I wouldn’t rant on this subject—and risk sounding like an arrogant ass—except that I regularly come across electronics errors in the boating press. Lord knows, for instance, how many times I’ve seen Ethernet and NMEA 2000 treated as though they were essentially the same (not!). At any rate, take care to treat printed words with appropriate caution (and if you’re an editor please consider having technical articles from uncertain sources double checked by an expert or two).
Whoa, things are happening even faster than enthusiastic yours truly thought possible. For $500, Maptech’s new Chart Navigator Pro (CNP) give’s you 13 (13!) DVDs containing NOAA’s entire portfolio of U.S. RNCs and ENCs, plus all of Maptech’s accessory cartography—photo maps, harbor panoramas, topos, bathy maps, pilot books, and information databases. But the real surprise inside is that Maptech ditched its aging, non-quilting, non-vector charting software in favor of Coastal Explorer. The name has changed, but CNP is CE 1.1 with nothing taken out and Maptech’s decent 3D contour engine added. CNP gets introduced today at the Fort Lauderdal Boat Show and will supposedly be in stores next month.
PS, 11/7: Thanks to Greg’s comment for a head’s up that Maptech has launched a new site, freeboatingcharts.com, where you can download all the U.S. RNCs you want. I don’t quite understand why Maptech is doing this before NOAA has a system in place, but it works fine. First you select the charts you want, then the site packages them up in a self executing zip file and notifies you when it’s ready for download. It only took maybe a half hour for me to receive the 15 charts that cover my area in all scales.
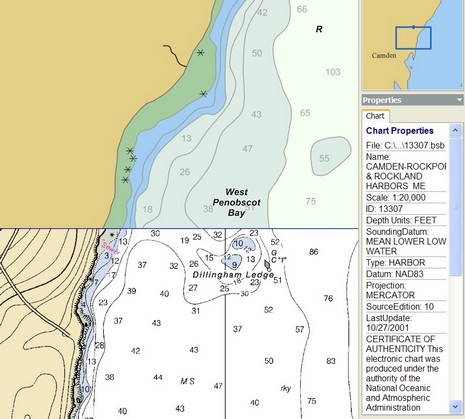
Rose Point Navigation just announced that Coastal Explorer is “the first program to include the entire NOAA chart collection covering all US waters.” What they mean is a sort of mulligan stew of cartography—500 ENC vector charts, 250 “Vector Coastal Explorer Charts” (which I think are actually derived from the DNC portfolio put together by NGA, the National Geospatial-Intelligence Agency, and also available from SoftChart for use with Capn 8.0), and 250 raster charts. In other words, they’re covering every bit of US coast at every available scale, but they’re not providing double coverage—raster and vector. By contrast, SoftChart is providing double and sometimes triple (two kinds of vector) coverage of many areas (at $200 per region), which can be darn useful for maximum detail and readability (I often cruise in Maine with both a vector and raster charts visible in split screen mode). I also noticed that CE has a little trouble perfectly quilting all three chart types, at least in my area, though below you can see how well it can do too.
But this is quibbling when you consider that Rose Point is including all 1,000 charts with its very able charting program, all for $400 total. The rasters will soon be on the shipping CD (DVD?) package, and are available for download now (though, as shown above, you need broadband). How did Rose Point get their mitts on these charts before NOAA has even started distributing them on its Web site? A good question, and the answer is about to reveal itself! And, by the way, can the worldwide portfolio of DNC vector charts, which seem to be downloadable, be used by the public? I really don’t know, but sure am curious.
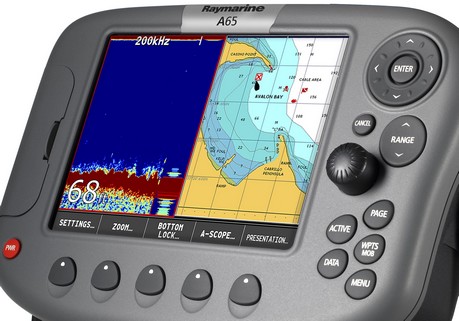
Next week in Ft. Lauderdale I’ll get an on-the-water demo of the new Raymarine A65 along with its included Navionics Silver chart card…so details then, apparent strategies now:
* The A65 is a 6.5”, though full VGA, plotter/fishfinder (or plain plotter) that seems to incorporate Raymarine’s crisp digital sonar technology and some of the friendly soft key interface seen in the C and E Series. It does not support radar, a high speed bus, or even SeaTalk2/NMEA 2000, but it does seem to offer some bigger boat electronics goodness in a smaller package (and price, though I don’t have the exact numbers just yet).
* The A65 comes with a Navionics Silver CF card that includes full detail coverage of the entire US coast. My understanding is that this signals the beginning of Navionics’ three tier chart strategy—Silver, Gold, Platinum…good, better, best. All the details aren’t out but the idea is that users of at least some machines can upgrade through the tiers as desired; meanwhile Navionics can move features down through the tiers as competition dictates. Slick.
The total package seems like a big “hello” to Garmin’s 192/198 series, Lowrance’s NauticPath etc., and also, in a way, to NOAA’s imminent giving away of all U.S. raster charts. (And a note to readers from outside the States: sorry that your governments are not pushing vendors to provide more and better chart coverage for less money, but then again you don’t have a powerful politician trying to gag your met offices.)
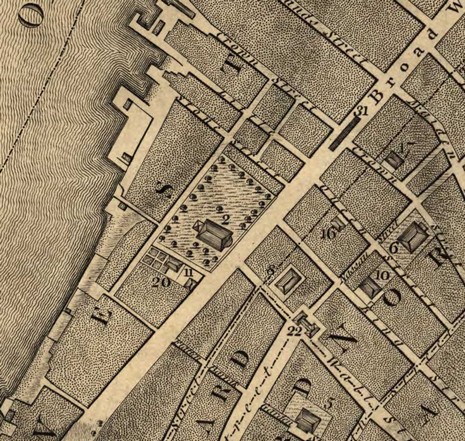
Back in April I noodled about the historical precedents to some of the neat features--like "points of interest" ashore--now coming to electronic charts. I showed a bit of a fabulous 1650 map of New England and promised to one day explain how to get your hands on high resolution scans like these. Today's the day! The source is the Library of Congress (LOC) Map Collection. Here's a link to the full 1767 map of lower Manhattan snipped above, and here's to 1650 New England. You can zoom around the online images but having the full resolution files on your hard drive is, of course, more fun, and they print very nicely. (Shown above, by the way, is the intersection of Broadway and Wall St. with Trinity Church, still there, keyed to a reference list with the "2". Part of my strong interest in this particular area is that the dock upper left on Little Queen St., now Thames St. and 6 blocks inshore from the Hudson, belonged then to Ellisons. Wish the land still did!)
But there is a problem with downloading these images, even assuming a 7.5 meg file is doable with your Internet connection. Some, like these, are in JPEG2000 (.jp2) format and others are in an even more obscure format called MrSID (.sid). Fortunately there's a nice freeware program called Irfanview that will read both formats and convert the images into .jpg or whatever. It's all a bit of trouble, but the maps and charts available from the LOC are fascinating. I dare say that one day some terrabyte plotter or charting program will include them as a sort of historical overlay. And, finally, if you are interested in how Manhattan and America really got started, check out Island at the Center of the World, which also has a Web site that makes use of old cartography.
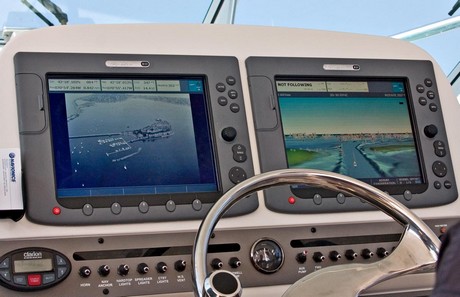
I’m back from Boston, where Navionics showed a bunch of boating writers what Platinum cartography looks like on the water, and also laid out its overall product plan for 2006. Panbo-wise, it’s all a little frustrating. I’ve been beta testing Platinum on a Raymarine E-120 all summer, and have tons of photos and screen shots to illustrate its features in detail. However, I agreed to Raymarine’s understandable request that I not use anything until the code is finalized. Soon, I’m told, very soon. (I got the shot above, and bigger here, during the demo; on the left screen you can see how big the oblique marina and port entrance photos are. Incidentally, when there was a chart on that screen, it was neat to see how well it could synchronize with the 3D screen at right, something I hadn’t seen in my testing).
Similarly, I can’t yet talk about what Navionics is up to in 2006 (very interesting). Instant Panbo publishing is a little too fast for these guys! I may run into this situation a lot this fall, as electronics companies reveal their new products, often timed to magazine cycles two or more months long. Plus my Panbo posting schedule is going to be choppy. In the next six weeks I’ve got a ‘research’ cruise with my daughter on the Hudson river, a press junket to the French Riviera, two trips to Florida (NMEA conference and Ft. Lauderdale boat show), and a completely non nautical but spectacular conference (Pop!Tech) where I volunteer so I can hear what some really large brains are thinking about our tech future. I think of this fall period as a regime of fattening my own brain for the winter ahead.


 Whoa, things are happening even faster than enthusiastic yours truly