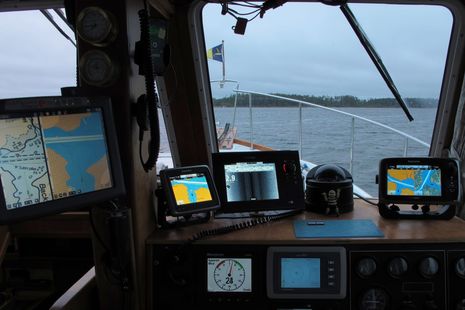
Yes, it sure looks like overkill -- and this shot doesn't even include the iPad that's often mounted here at Gizmo's lower helm -- but I've definitely found ways to put all these screens to work. In this particular scene the boat is crawling out of a very shallow back creek (actually called Back Creek) where we'd hidden from the worst of a cold gusty low that had me wondering if spring would ever materialize. It was still gusting in the high 20's and that's only 2.8 feet under the StructureScan transducer that's fastened to the keel forward. If you look closely you'll see many chart types, including the C-Map Max format now well supported by Coastal Explorer. The day before I'd gotten a serious reminder about the value of multi charting...
I've heard of hitting "the bricks" as in going hard aground -- as well as "bricking" a computer (or other gadget), as in breaking it so badly that it's only good for a door stop -- but gCaptain surprised me with "USS Guardian is Fully Bricked Up and Getting Battered on Philippine Reef." The situation is even worse since the minesweeper swung 90 degrees and is getting so hammered that it's hard to imagine how it can be removed from the tiny Tubbahata Reefs National Park. Thankfully no one was hurt (to my knowledge) but I'm probably thinking about terminology because it's horrible to contemplate what those pictures imply about the damage to ship, reputations, and -- most important -- precious wildlife. How could this happen?
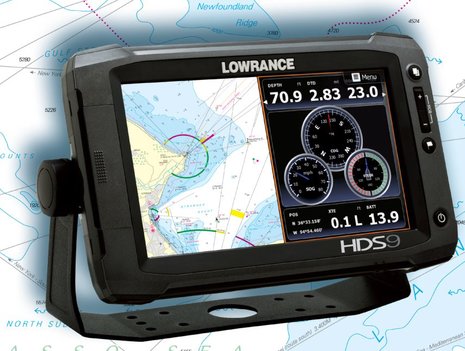
The surprising press release just came in this morning. I didn't even know that Navico multifunction displays could handle "raster" style digital charts -- the ones that look like paper charts -- let alone that NV Charts was working to make its large portfolio of handsome cartography available to the owners of Lowrance HDS, Simrad NSE/NSO/NSS, and B&G Zeus MFDs...
When I wrote about NV Charts after the 2011 Miami Show, I appreciated their unique approach to recreational charts. For one thing, they make their own (though based on official sources), and for another they won't sell digital versions without the paper version (or vice versa, your choice!). But now that I've had some hand's on time with the actual products, I'm even more appreciative. These are beautifully made charts no matter which way you look at them...
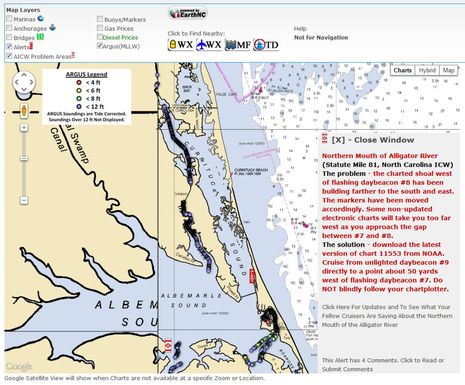
As a guy who may actually cruise the Intercoastal Waterway this fall (as opposed to last year, when I only talked about it!), I'm delighted that there's so much competition to collect and share relevant information about it. A particularly notable development is the way CruisersNet.net has teamed with Survice Engineering and EarthNC to overlay the former's "Argus" volunteer-collected and tide-corrected depth data onto the latter's slick online charting engine, along with lots of other valuable CruiserNet info. The screenshot above shows hundreds of recent ICW soundings less than 12 feet, and also a professionally researched "Problem Area" note, and of course you can drill down to much greater detail...
I've been using Navionics "Freshest Data" for almost a year now, and while it takes some getting used to and I have experienced a few glitches, my access to up-to-date charts has become nothing short of astounding. I can use the regular SD card reader on any of my computers to freshen a chart card right up to whatever changes Navionics cartographers have made to the master database that day. Plus each of the new generation Gold and Platinum+ cards comes with a voucher that you can use to download another set of charts -- any set! -- to your PCs, and they too are automatically updated every time you open the included Navionics PC chart viewer...
That's New Zealand's fascinating Fiordland coast and while I'm not positive the photo was taken from a helicopter, I do know that the solar-powered navigation light in the foreground is serviced by one. Which is how the technicians who recently added an AIS transponder to the site got there too. But you won't see the nav light on an AIS plotting screen because the transponder is programmed to mark a dangerous submerged rock at the mouth of Doubtful Sound 3.4 miles in the distance. Now the visiting cruise ships report that they can now plot Tarapunga Rock from 10 miles offshore or from two miles inside the Sound. The concept is called a Virtual Aid to Navigation, or VAtoN, and while it's the first I know detail of, I'm doubtful that it will be the last...
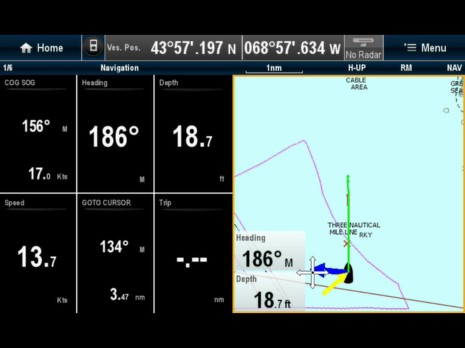
The Raymarine e7 that's been in the Panbo lab for a few weeks is proving itself quite able and well designed, but I've come across enough little glitches and omissions that I think it's also a good test of the new Ray's ability to push out software fixes and improvements. That chart window above, for instance, should be showing
spot soundings. Now it could be that I don't have the chart presentation set up right, but even if that's true, I suspect the menus involved can be improved to help a user like me. On the other hand, that screen shot is from an iPad streaming the e7 over WiFi, and that feature not only works well but continues to intrigue...
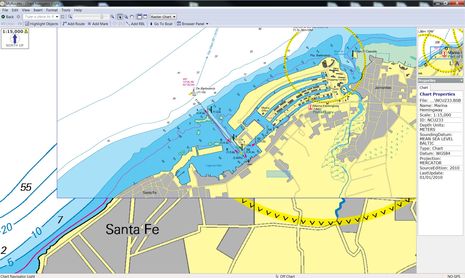
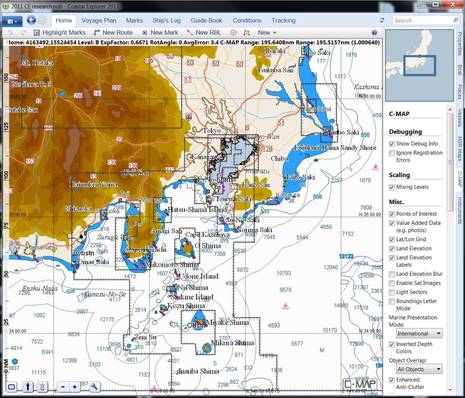
It may not matter if you don't cruise outside the U.S., but Coastal Explorer users who do seem quite excited that the PC charting program will soon support the worldwide portfolio of Jeppesen C-Map Max charts and maybe even the older NT+ format. You can hear the enthusiasm, and learn a lot of detail about how the support will work, by checking out this CE Beta testing forum entry. Better yet, if you already run CE 2011, you can download the Beta from the same page and then use its rich chart management features to download some of C-Map's generous demo cartography...
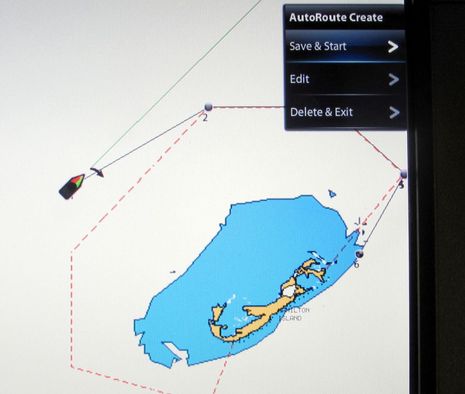
FLIBS was my first chance to see the autorouting capabilities of C-Map 4D in action, and I liked what I saw. And not only is Geonav the first to make the feature available but it's also the first to enable a similar autorouting feature from Navionics (which I wasn't even aware of). As with other "Dual Fuel" chart features, Geonav tried to make the interface on the G12 (and G10) the same so that users switching between C-Map and Navionics cards aren't confused. That's why the details of the menus above and below are the same no matter which type of chart you're using...