NV-Charts on Navico displays, another 'paper' option!

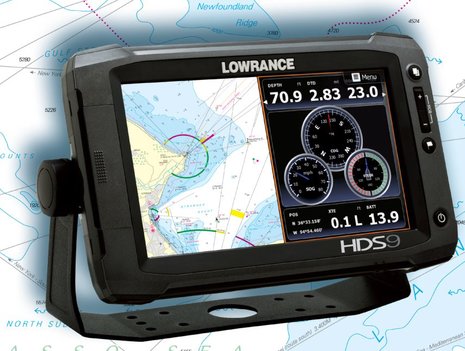
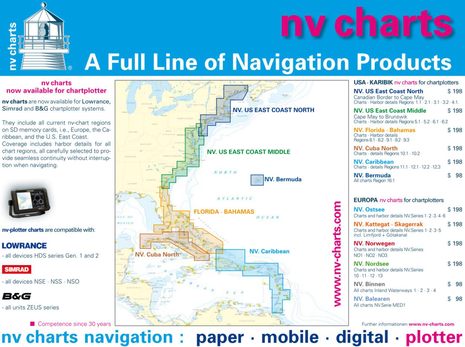
The surprising press release just came in this morning. I didn't even know that Navico multifunction displays could handle "raster" style digital charts -- the ones that look like paper charts -- let alone that NV Charts was working to make its large portfolio of handsome cartography available to the owners of Lowrance HDS, Simrad NSE/NSO/NSS, and B&G Zeus MFDs...
You may recall that I reviewed NV paper chart book kits last summer, along with the included CD files that can display in charting programs like Coastal Explorer. I really like the design and detail that NV brings to their charts, and I like rasterized NOAA charts too. They may be a lot "dumber" than a vector charts -- they can't scale elements as you zoom or keep soundings numbers and label text right side up if you go to "head up" mode -- but then again a vector chart is finally "drawn" by algorythms, not the original cartographer, and I've seen many instances where that process is imperfect.
But the display of raster charts on MFDs has been rare, probably because they are large files to store and process. The high-end Furuno NavNet 3D series can do it quite well, even showing rasters contoured and 3D (which may look odd in screen shots but often works well for me), and Jeppesen C-Map 4D has included a NOAA raster layer for some time, but 4D isn't supported on major MFDs (Standard Horizon CPN excepted) and neither MapMedia (Furuno) nor C-Map seem to offer raster coverage as wide as NV's anyway. It will be interesting to see how well these NV Charts run on the various Navico MFDs and apparently they are available for sale right now, even if not yet listed at NV-Charts.com. If you try them (as I hope to), please share your experience...

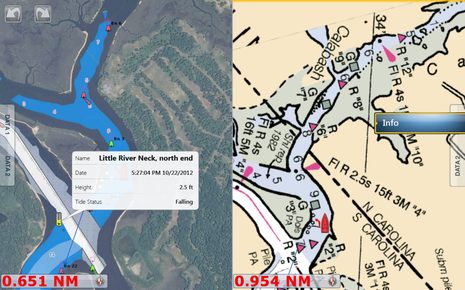
And hat's off to Navico, by the way, for offering their users more chart choices. Current Lowrance and Simrad displays can already display various Navionics cartography packages up to Platinum+ as well as Navico's own Insight HD charts (getting better all the time, though U.S. only), and I even tried inexpensive FlyToMap vector charts on the NSS last summer (they needed more work). Actually, I like to have multiple chart types available if not on screen together, and I'll close with some illustrative screens from the Furuno TZT14 that installed at the end of Gizmo's fall cruise...

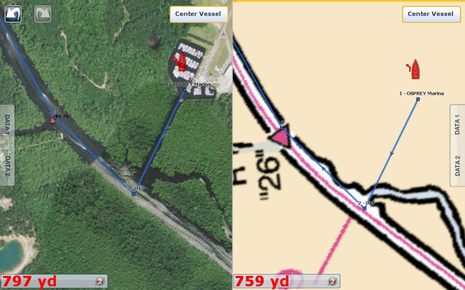
I liked running the ICW with both vector and raster charts side-by-side, and with MapMedia's hi-res photo mapping usually overlaid on one or the other. Maybe it's my age but I find that NOAA raster at right above quite informative. Perhaps it's knowing that a human decided what to emphasize? I also like how a raster charts, designed as they were for print, always reveal the scale of data the cartographer felt able to use. For instance, when you "over zoom" on a bit of waterway, as seen below, that big "26" is telling you be careful about presumed accuracy. Note, though, how any chart can miss a significant feature like Gizmo's current marina, though it shows up great in the satellite photo. I wonder if NV Charts will be able to display with photo maps and vectors on Navico display, but even if they can't it's good news that they're on MFDs at all.


 Share
Share
:-)
1 step closer to weekly SOLAS (BaZ) chartupdates for our sandy Waddensea