Did you ever see the first-in-20-years Bob Dylan interview with Ed Bradley where Dylan expresses astonishment at lyrics he himself once wrote (like It's Alright, Ma), and said he couldn't do it again? A memorable TV moment with a weird and reluctant diety, I thought. My work is absolutely not comparable to Dylan's, but I do sometimes run across a piece written long ago that surprises me in a good way. That happened today with a 2004 PMY column called "Monkey Business" whose catchy subtitle was "Charts separate men from apes, but the path from paper to digital passes through the jungle." I thought I'd republish it with the images that are no longer online, plus links, corrections, and more images. Hope you enjoy...
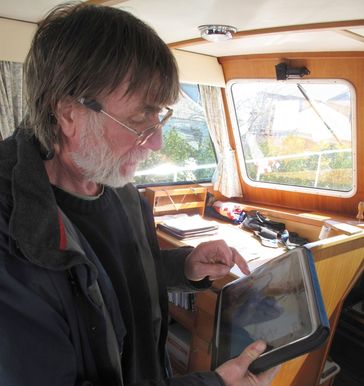
Nigel Calder and I talked non-stop for about six hours on Friday (and probably could have kept going if we were younger men). He visited because he's working on a new edition of How to Read a Nautical Chart and wanted to check out the latest in electronic charts, particularly the mobile apps. I was happy to help with that, and I also got to ask some questions about Gizmo's systems and find out what's up with his marine hybrid project. I've always liked Nigel's chart book; while it's largely a nice reprint of NOAA's Chart 1 guide to symbology -- no longer published by NOAA, though available for download -- it also includes some terrific history of cartography along with analysis of where it's going electronically. I'll be particularly interested to see what he discovers when visiting the Chart of the Future project at UNH, which is apparently related to a new vector chart standard (interesting S100 PDF here). I was also pleased to learn that Nigel shares my enthusiasm for improving charts with crowd sourcing and even for 3D charting, and he's not a guy who's easily impressed with the latest thing...
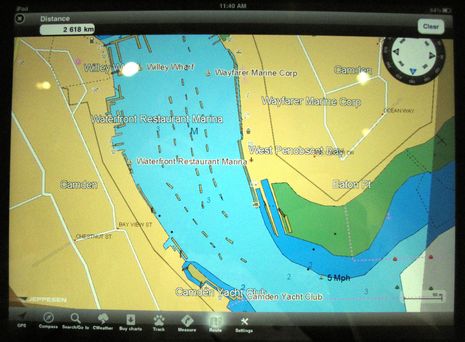
It's a lousy photo, for sure, but Jeppesen C-Map has not yet announced its iPad charting app, let alone released screen shots, though I found it one of the nicest surprises of the Miami show. It seems that C-Map not only intends to match Navionics' much appreciated efforts to offer inexpensive but detailed marine cartography on multiple apps platforms, but to do it even better. Note, for instance, the "CWeather" button on the menu bar above, and that C-Map has been working to overlay weather data on plotters since at least 2004 (though the then available mechanisms -- a complicated cellular connection, or a data card transfer -- were awkward). I'm not sure what CWeather offers today (the Jeppesen site says only European data), but we do know that a connected tablet or phone can make the download process very easy.
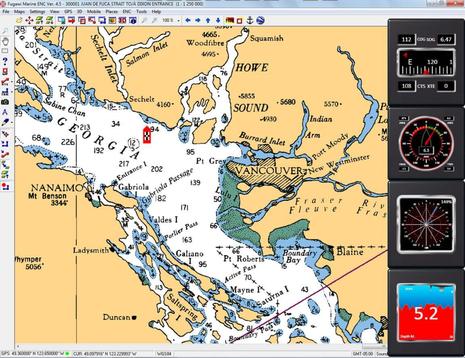
I sense that PC-based navigation is about to enjoy a renaissance after a long period during which rapidly-advancing MFDs stole its thunder. I can think of several reasons (and you may have more): Decent performance PCs have gotten less expensive and tougher; NMEA 2000 can feed them more data, more easily (thanks in large part to Actisense); the various mobile platforms so many of us want to fool with on board usually relate well to the less mobile platforms that can also work well on many boats; and, finally, MaxSea and Furuno are showing everyone how powerfully a PC can fit into high-end marine electronics systems. One company that will participate in this renaissance, I'm pretty sure, is Fugawi...
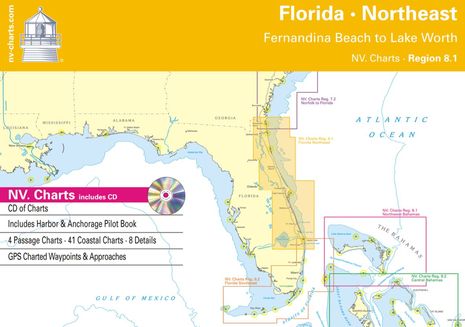
I've known of NV Charts for years as a German supplier of cartography for Europe and the Caribbean, but I'd never met founders Cornelia and Hasko Scheidt until this Miami show, and I had no idea that they were expanding into the U.S. with a very interesting model. The Scheidts -- whose perhaps-telling business-card titles are Art Director and Hydrographer -- are creating custom paper charts based on NOAA vector data with their own survey work added, which they also produce in multiple digital forms, though they'd rather you didn't use those without the paper versions on board...
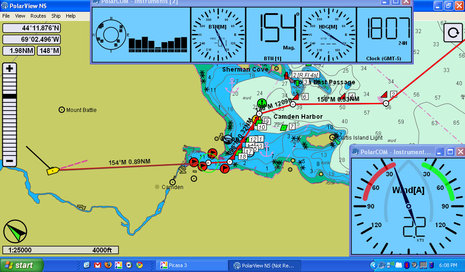
I took a peek at PolarView NS charting software about a year ago, but didn't write about it because I wasn't especially impressed (and there's a certain randomness to what I cover anyway). But times change and software develops, and I'm here to tell you that PolarView 1.5 (video introduction here) is pretty darn impressive. Given its app-like $40 price tag, it's a remarkably powerful program that runs on Windows, Mac OS X, and Linux operating systems. The screen above shows PV running on my little ASUS Eee PC 1000HE 10-Inch netbook
with live NMEA 0183 data coming from the lab's N2K network via a Maretron USB 100. PolarView is quite unusual in that it uses a sister program, called PolarCOM, to do all its data interfacing and instrument displays...
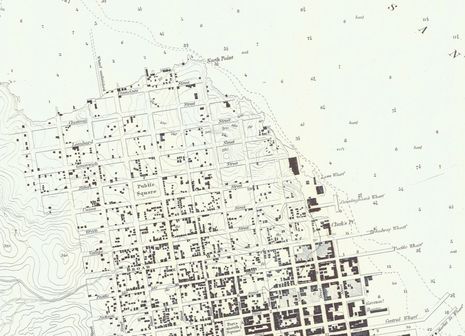
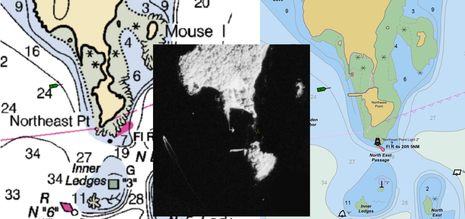
Yet another blizzard is descending on Panbo HQ, and that's excuse enough to further indulge my obsession with local charting, specifically the issue mentioned on Monday about how Northeast Point became an island. It may be a trivial matter, but it does illustrate some technology NOAA is using these days, and perhaps why we should be skeptical about the results. The collage above shows how the Point's shoreline has been depicted on the paper/raster version of chart 13307 for more than a century; the infrared aerial photograph, carefully taken near the time of mean high water, purportedly shows the actual shoreline; and the new vector version of 13307 shows how that recently acquired shoreline data was applied. The trouble is that some rocky reality seems to have been left out of the picture!...
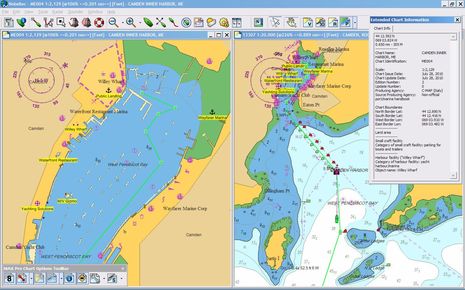
Testing Nobeltec Admiral 11 is going pretty well, and I'll write about it soon, but what really got me grinning is the latest C-Map Max Pro chart of Camden Harbor that came along with the trial software. I'm a long time fan of C-Map's C-Marina concept -- in which cooperating marinas are charted in super high resolution -- but in actuality C-Map's earlier attempts at Wayfarer Marine detail were seriously flawed. Well, not only is Wayfarer now exceptionally well depicted (with one major exception), but other improvements make C-Map's the best visual guide to my harbor's complexities yet created, I think. Please click on the image above for a full screen window as I explain...
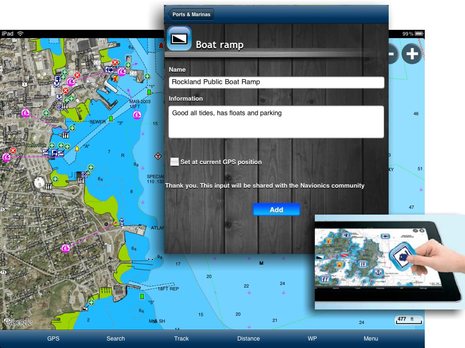
Wasn't it telling that three DAME awards went to iPad apps yesterday (even though only two were entered)? I can't find the full award text online yet, but the judges explained their Marine Related Software choice of Navionics Marine: Mediterranean HD thusly: "This system's ease of use was better than any the Jury had seen to date. With fingertip control provided by the iPad it was extremely easy and intuitive to manipulate the charts and establish routes and waypoints. Moving from screen to screen, updating charts, and zooming in on a landmark was expected to be very simple even on a moving boat." It's a bummer that all regions of Mobile 5.0 aren't out yet, but testing Beta versions for Canada, the Caribbean, and U.S. East leads me to concur with the judges, particularly in regard to the updating charts. Creating user generated data -- the major feature of 5.0, as emphasized in the Navionics graphic inset above -- is so much easier on a big screen with a big keyboard...
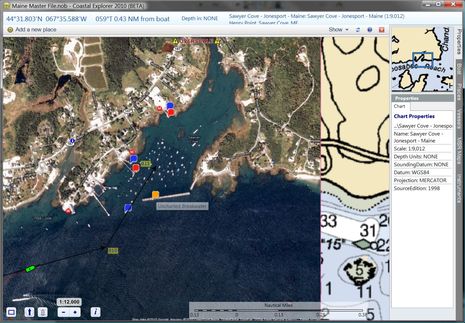
An interesting solution for the Jonesport uncharted breakwater problem came all the way from the S/V True Love in La Paz, Mexico. Skipper Bill Stockton has written a program called ChartAid which can turn Google Earth photo maps into BSB format so you can navigate on them in programs like CE, Nobeltec, and Chart View. I did get an "Invalid BSB" warning when I installed the chart Bill sent into CE, but it works fine. As you can see above, the registration with the official chart looks good, and my vessel, track, and route, plus data sets like GuideBook, overlay properly. Even the "properties" make sense, with the possible exception of the Source date. And apparently it's easy to make such photo 'charts' with ChartAid...