
C-Maps in Coastal Explorer, never enough charts!
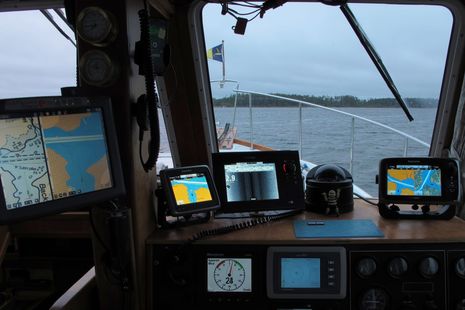
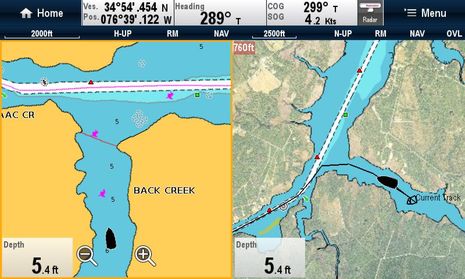
Yes, it sure looks like overkill -- and this shot doesn't even include the iPad that's often mounted here at Gizmo's lower helm -- but I've definitely found ways to put all these screens to work. In this particular scene the boat is crawling out of a very shallow back creek (actually called Back Creek) where we'd hidden from the worst of a cold gusty low that had me wondering if spring would ever materialize. It was still gusting in the high 20's and that's only 2.8 feet under the StructureScan transducer that's fastened to the keel forward. If you look closely you'll see many chart types, including the C-Map Max format now well supported by Coastal Explorer. The day before I'd gotten a serious reminder about the value of multi charting...
I wrote about CE's support of C-Maps in late 2011, when the feature was being beta tested, but recently Rose Point kindly let me test their online purchasing system and I must say that it's slick. There is a add-on module you need to download but once that was done and the transaction made, my home computer downloaded all the C-Map Max charts for the East Coast and Bahamas including additional data like tide stations, port photos and the extra C-Marina detail I've come to appreciate.
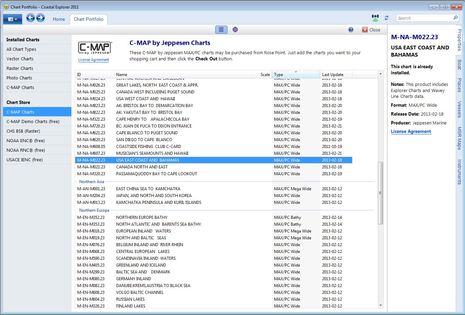
The neatest part, though, was when I got to the boat and found out how easy it was to sync the purchase to both onboard PCs, as explained here. And, yes, there is a work around if your navigation PC does not have a good Internet link for the download.
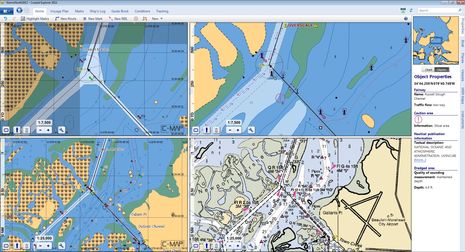
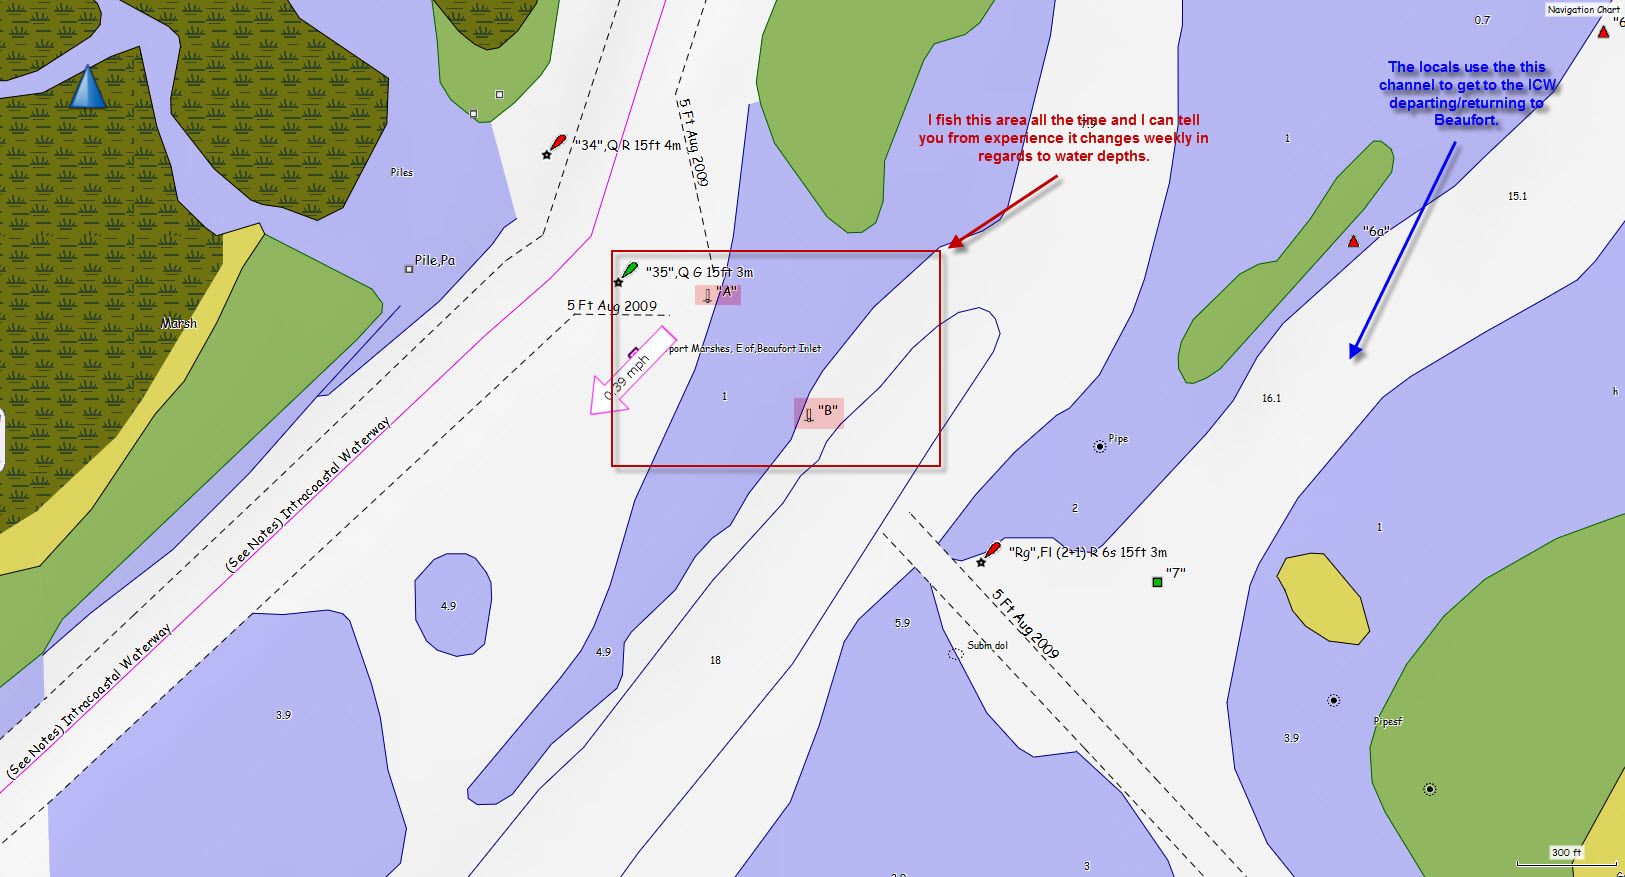
At any rate, I was appreciating the C-Map data presentation right up to my exit from Beaufort, NC, when I started cursing the company! The four panel CE screen above is definitely worth clicking bigger while I explain the detail. First note how I had created a route that cut from the north side of Beaufort to main ICW. This seemed reasonable especially given how the upper left C-Map detail showed a white channel just like it and most charts show wherever areas are dredged to a certain depth. But this is a very confusing area and I was out there in lots of wind and current when I put my binoculars on the first of those two "yellow" beacons marking the final cut and discovered it was a white Danger sign. That's when a quick look at the NOAA raster chart (lower right) suggested that there was only a foot of water there and the slightly zoomed out C-Map (lower left) put it at "0" feet. Yike.
But after some later investigation I have to give C-Map some credit. The NOAA ENC seen upper right does indeed indicate a dredged channel of 4.9 feet through the Russell Slough, though they've presented it in way that much more distinct from the ICW and put a "!" caution mark explained in the chart "object" panel at right. By the way all of these are very current charts -- CE is great at updates if online -- and thus a vivid example of how confusing data and presentation can be.
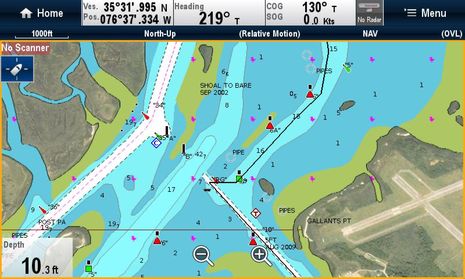
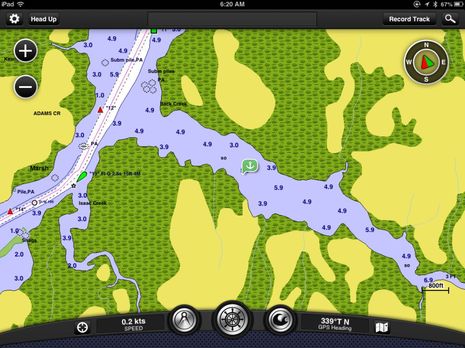
The Raymarine e7 Navionics Platinum+ cartography seen above is not as current as what's on the CE (I haven't gotten Freshest Data going yet this year), but it would have kept me out of trouble and was helpful after I made a u-turn and then slowly figured out the alternate channel which seemed at first to have me putting both green and red beacons to port (it worked). I really appreciate how I can fiddle with the "Safety Depth" level on these Navionic charts to get some color shading that's useful even in these quite shallow waters. The same is possible with ENC vector charts in CE but C-Map has not made that feature available so far (let's hope for a change).
Not that Navionics is perfect either. I have no idea what was meant by that line shown crossing Back Creek above (at some zoom levels), but I know for sure it's not anything real. But then again I do find the Platinum hi-res satellite photos useful sometimes, in this case indicating enough trees and topography that Back Creek might be less exposed to wind than the regular chart data suggested. But I do wish I'd taken a look at Garmin BlueChart Mobile before I went into Back Creek, because the ActiveCaptain anchorage info would have added to the confidence all those screens seen in the top photo helped me with. I had a nice night there despite the weather. And yesterday I got the Furuno TZT and DRS2 radar all updated and functioning (while anchored in another shallow creek) so now Gizmo has even more chart types and presentations available. I suppose one boat can have too many chart choices, but at least it may generate some more interesting examples of how they can differ.
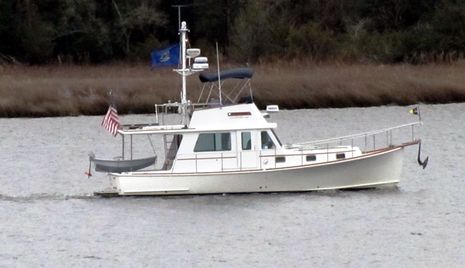
PS 4/21: Thanks to a resident of Back Creek (and the wonders of the Web) here's a shot of Gizmo taken at about the same time I took the top photo:
Ben, Nice specific on how multiple chart sources can be so helpful - and sometimes necessary. I am feeling really good about my plan to include Coastal Explorer, Garmin, and Simrad displays at my helms. The incremental cost is quite justified by the confidence with which you can pilot through new and sometimes confusing waters. With multiple helms an iPad as a secondary display is a real bargain. BTW I highly recommend the Lifeproof waterproof iPad case. I suspect it is the least obtrusive of the many choices and certainly waterproof - short of swimming with it.
Best wishes for fairer weather as you continue north. Brian