
iPad GRIB viewers, Weather4D & WeatherTrack
When I wrote about Garmin's new GDL 40 cellular weather system recently, the comments reminded me about how many different ways there are to access data and forecasts (and how opinionated some folks are about the methods they favor). So I guess I shouldn't be surprised when two apps that both specialize in downloading and displaying GRIB weather model data on iPads, or their smaller siblings, take quite different approaches to the task...
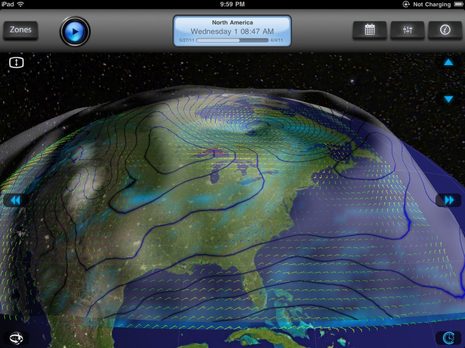
Seen in the top screen is Weather4D, a $6 app that just went into its 1.1 universal edition with all sorts of slick improvements. I think it's truly earned its multi-dimensional title as it can not only give some 3D contouring to high and low pressure masses but it can animate them smoothly through the time dimension. Watching a deep depression cruise across the Atlantic with, say, wind barbs and precipitation shading also overlaid is a sight to behold. You can almost feel what it's like for a sailor underneath.
I tend to use GRIB visualizations mainly to understand the big forecast picture, but you can zoom in to more local conditions. On the main Weather4D screen above you just tap on that lower left "Orbiting Mode" icon to pan and zoom around the underlying Google Earth map. Then a tap on the lower right "Time Mode" button lets you swipe through forecast intervals, or you can use the top bar to play the animation, reset to current time, or pick a date off a calendar. A tap on center screen brings up the overlay icons -- with active layers outlined in blue -- that I've cut and pasted to each side of the image.
Note, for instance, the moon/stars "show night" icon, which is why it was getting dark in Nova Scotia Friday evening at 7:25 EDT. And when you are zoomed out as in the top screen, the Milky Way spins appropriately through the heavens. There's much more to Weather4D but suffice it to say that I don't know of a weather app that takes advantage of an iPad's speedy touch screen so well.
But the data Weather4D displays seems rather paltry once you've had a taste of WeatherTrack, "The Swiss Army Knife for Weather Enthusiasts!", which costs $20. Sure, both apps let you define custom download zones and control the forecast resolution, time interval, and data types in order manage the download sizes, but Weather4D currently only supports the five main data types generated by NOAA's GFS model. The left hand WeatherTrack screen below suggests all the models I've set up views of, and the middle screen shows all the GFS data points that can be downloaded...
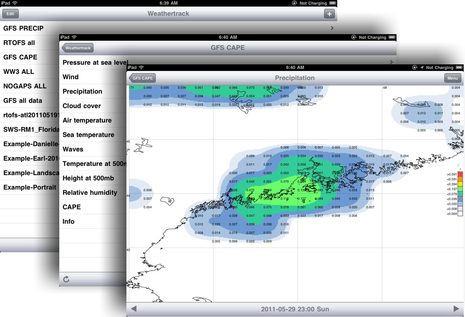
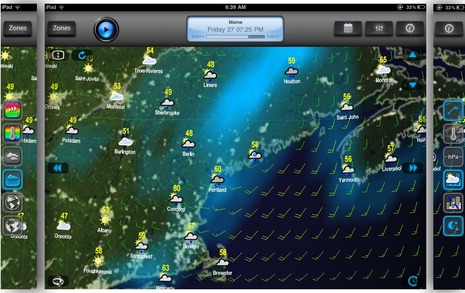
Actually a couple of those data types, like Relative Humidity and CAPE, won't be available until WeatherTrack 1.2 ships in a few days (I recently got a Beta version). CAPE, incidentally, stands for Convective Available Potential Energy, said to be a good predictor of severe weather, but I suspect you're getting the idea. In general, the WeatherTrack developer has put his energy into data versatility while the 4D guy went more for display and interface. One exception I notice, though, is the presentation of GFS precipitation forecasts. You can see it above depicted as a somewhat vague blue overlay in 4D and more like multi-color NEXRAD radar in WeatherTrack. (By the way, the Friday night showers predicted that morning stayed north of Camden while -- to my amazement -- the Sunday evening rain cell predicted Saturday morning did actually nail us, though a few hours later and with more intensity.)
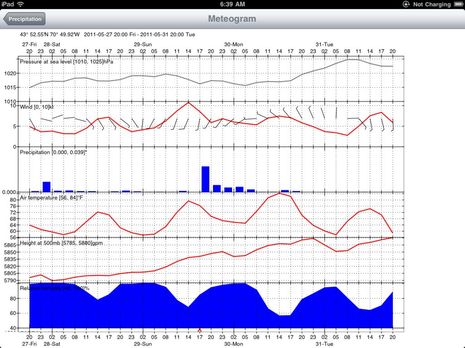
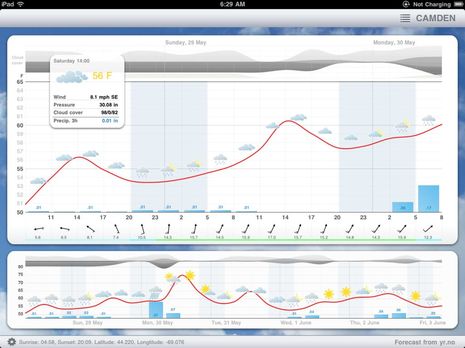
But WeatherTrack does not let you mix data type overlays on a single map screen like 4D (and many other Web and PC GRIB viewers I've seen). I find that a real shortcoming as it seems to help me understand what's going on to see, say, pressure, wind, and precip inter-relate over a forecast period. On the other hand, WeatherTrack largely makes up for this with its neat meteogram feature. Tap on a location of interest and you can immediately go to a screen like the one below that graphs all of a file's data for that point over time...
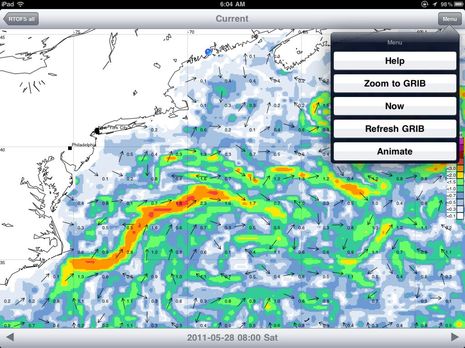
And I don't think there's another app out there that can access the RTOFS model of Atlantic Ocean currents and surface temps, even if you can only view one value at a time. (The hot colors below map current speeds, even if they do correspond somewhat to the hot temps of the Gulf Stream.)...
So I'm liking both these apps a lot, and will be curious to watch their evolutions. Of course, I'd like to hear what you think of them, or alternative forecast viewers. And if GRIBs aren't your thing but you do have an iPad, you might enjoy Meteogram. It certainly can't display all the data WeatherTrack's meteogram can, but it's only $2, operating it is simple, and the screen design is gorgeous, I think. Note, for instance how three layers of forecast cloud cover are depicted. Note too how the sun and warm air finally arrived in Camden yesterday -- after weeks when summer boating seemed like it might never happen -- which is one of my excuses for neglecting Panbo a bit ;-)
Nice PS: The developer of Weather4D is offering free redeem codes to the first 20 Panbo readers who send an email to this address:
[email protected]
Panbo and MTA would appreciate it if those twenty lucky folks also commit to taking the marine electronics survey:
https://www.surveymonkey.com/s/ZYPFC2W