
MTA: So what are electronics buyers investing in?
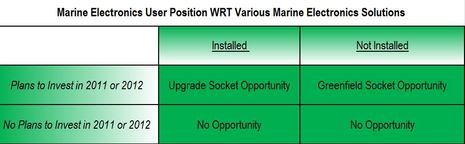
Last week Marine Technology Advisors (MTA) began publishing more results of the 2010 survey. This is the second installment: Among a long list of market characteristics MTA tested for - and will be testing again - was the current rate of installation for more than 60 technical segments. We asked survey respondents to cite their current position with these marine technologies in one of the four states diagrammed below. What we found was a electronics market with a broad range of market development maturity across more than 60 technical segments. Can buyers and suppliers enhance their relationship(s) by thinking about their solutions from this perspective? Can users and suppliers of materially different technical solutions benefit from common market development strategies? We think so...
A Worthwhile Way To Organize A Highly Fragmented Market?
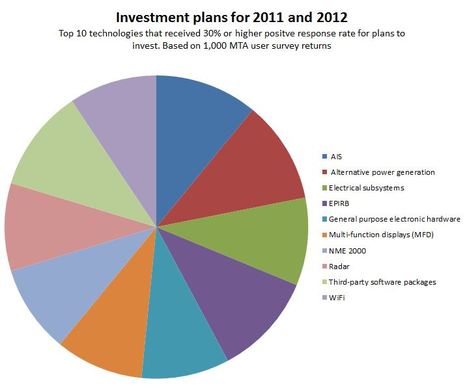
Lets see if this framework is instructive. We will take a look at three sets of technical segment opportunities in the recreational marine electronics market - based on 1,000 MTA user survey returns. The technical segments presented here are a subset of the more than 60 technologies MTA tested in its last survey. These are the top ten technologies that received 30% or higher positive response rate for plans to invest in these technologies during 2011 or 2012 (alphabetical order):
1. AIS
2. Alternative power generation
3. Electrical subsystems
4. EPIRB
5. General purpose electronic hardware
6. Multi-function displays (MFD)
7. NME 2000
8. Radar
9. Third-party software packages
10. WiFi
Pretty interesting when you think 1,000 highly qualified private vessel owners and operators invested 20 minutes of their lives to complete this survey. (They were rewarded with a contribution to two global charities.) These were the top ten most often cited planned investments for survey respondents. Obviously there are any number of logical next steps to analyze these opportunities:
- Demographics of users that cited these technologies - and demographics of those that did not - homing in on the core market
- Product selection criteria for these technologies - honing the market messages
- Vendor and source selection criteria for these technologies - channeling resources
Takeaway: Different Segments, Different Penetration/ Maturity Levels, Different Strategies
But, what about a different, perhaps equally valuable framework for considering these technologies. A framework that might aid buyers, suppliers and resellers? Lets try.
Upgrade Sockets - These are the technical segments where the highest share of respondents planning to invest already have the solution currently installed. Legacy integration - mechanical, electrical, electronic - matters. Users' visceral experience with the installed base of systems matters too.
Greenfield Sockets - These are the technical segments where the highest share of respondents planning to invest do NOT have the solution currently installed. A significant amount of market education and training may be required with these solutions. A number of likely unforeseen enabling technology upgrades matter, too.
Mixed Sockets - Technical segments with high rate of investment planned, and a high rate of mix between those with solutions already installed (Upgrade Sockets) and not installed (Greenfield Sockets). Well, as you might guess, combinations of both conditions above, existing in every imaginable mix.
Approximately 36% of survey respondents cited they would be investing in the following technologies:
1. Third-party packaged software
2. Alternative power generation subsystems
3. EPIRB
One of these markets is Greenfield with 74% of those investing for the first time. Another is Upgrade with 70% investing in installed systems. The third is a Mixed market, with a 45% upgrade/ 55% new install mix. Can you guess which is which?
Ben,
Deconstructing the pie chart gives the following: approximate information.
AIS=10.8%
Alternative power generation=10.8%
Electrical subsystems=10.8%
EPIRB=10.6%
General purpose electronic hardware=9.9%
Multi-function displays [MFD]=9.6%
NMEA 2000=9.5%
Radar=9.4%
Third-party software packages=9.3%
WiFi=9.3%
This means there is a 14% spread between the largest and the smallest segments--not much differentiation based on consumer spending plans.
There is a noticeable break between EPIRB and GPEH however, it is barely one standard deviation, and so it may be a distinction without difference.
If this were a company portfolio of lines of business, from what I see here, I would ditch WiFi and Third Party Software as lines of business, but not because of their spending predictions.
WiFi is too easily jerked around by large provider decisions and the business model is still ugly for the non-business user who has no one to pass costs on to. Smartphones are also a disruptive technology where WiFi is concerned. A year of unlimited data via cellular can still cost about the same as the marina-days of paid WiFi associated with a year on the water and offers better security. If one needs the cellular data plan anyway, why mess with WiFi? Also, margins here don't look so hot (unless you are providing a paid WiFi hot-spot which is a cash cow).
Third party software (almost) always has great margins, sometimes well into the 90% range, but here, good enough is good enough and feature creep is delivering increasingly complex and complicated solutions. Also smartphones and apps are a disruptive technology that would make me quite leery of investing in another mega-suite PC/MAC based package for boat owners. Clearly, there are some harvestable niches, particularly those enabled by NMEA 2000 data flows, but as soon as NMEA starts porting reliably to smartphones, I suspect Apps on Tablets (the new MFD?) will rule.
Just some thoughts. I'm a data junkie...