MFD comparisons #2, mostly currents
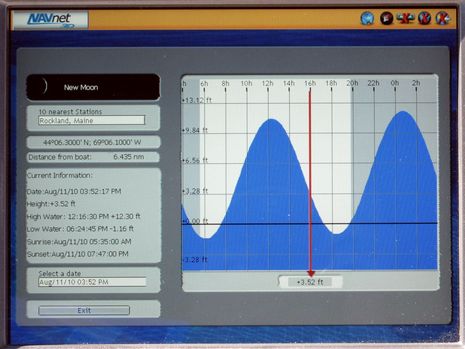
I sort of knew that "shootout" was a poor word choice -- implying the certainty of corpses and so forth -- and I'm officially dropping it from the Panbo title vocabulary; it's too hard to be that certain! A glaring example was omitting Furuno tide graphs from the MFD tide "shootout"; I knew better, really, but somehow briefly lumped tides and currents into the POI info that's so far missing from the NavNet 3D charts (but won't be once Active Captain and C-Map data is supported). In fact, you just click and spin the RotoKey to Tide Graph, click again, and you get the nice screen seen above of the nearest prediction station. But it's not perfect, and when it comes to current predictions, it looks like none of the MFDs are...
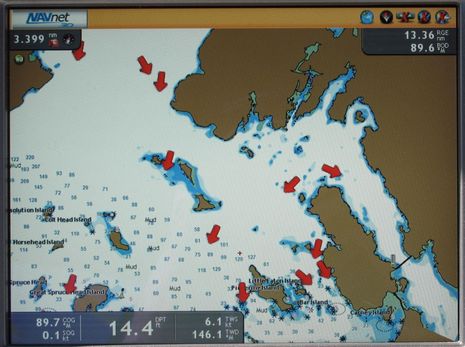
If you click on the Furuno screen above, you'll see that yesterday's midday High in Rockland was predicted as 12.3 feet, but the Garmin 7212, Raymarine E140 Wide, and Simrad NSE12 all had it at somewhere between 11.3 and 11.6 feet. In fact, the NN3D number doesn't equate to its own graph; 12.3 -- actually the am heights -- appears to be a mistake. I was somewhat surprised to see slightly different predictions from all the machines, but the formula is complex, with numerous harmonic constituents, and besides we don't need precise predictions even if the tides themselves really were that precise. That's why I think it's just noise to predict tides to seconds and 100ths of a foot, as Furuno does, (I even like how the Canadians round all tide and current predictions to five minute increments).At any rate, things got dicier on all the MFDs when I started looking at Current predictions. I like the way NN3D can overlay current arrows for the numerous prediction stations in my region, but it can't animate them over time or graph them. MaxSea Time Zero can animate current arrows, and will get current graphs eventually, I'm told, as may NN3D. (The screen shot below also illustrates the improved ENC/S57 display that came with the latest NN3D update, but also the fact that Furuno can't provide data where NOAA hasn't yet created it; there are no soundings in that blank area no matter how deep you zoom in, and I'm looking forward to trying Jeppesen C-Map vectors on the MFD12.)
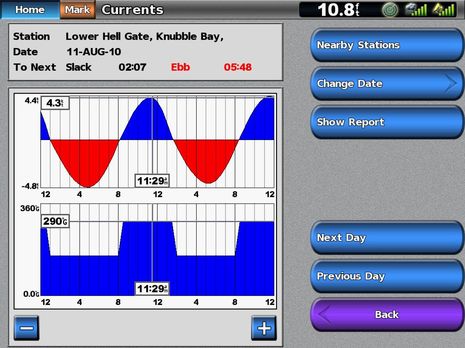
 Meanwhile, I was surprised to find that the Garmin 7212 apparently won't predict any of those currents seen above, nor many others in my area, though it does a fine job graphing the data stations it does have, as seen below. You can view the data in text table form or, better yet, move the prediction line (seen at 11:29 below) across the graph with your finger tip. The Simrad NSE offers no currents at all {Wrong! see below}, as noted in the tide prediction comparison, while the Raymarine E Wide has a full selection of current stations with graphs and tables. However, Ray's current table isn't in chronological order, which is confusing (and unlike its tide table), and all the current predictions seem able to differ more than a little from the official data. The NOAA table, for instance, shows yesterday's flood at Lower Hell Gate maxing at 3.4k at 11:11, while Garmin predicts it at 4.3k a few minutes later. That's over 25% off, right?
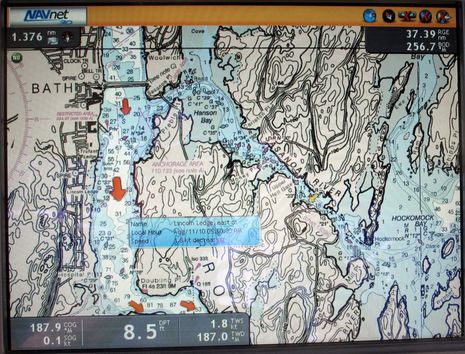
 By the time I finished looking at MFD current predictions last night, I thought the Furuno seemed capable of being most off, particularly comparing that 1.8k ebb calculation below to Garmin's 3.7k and Raymarine's 3.6k for the same time and station. And given NOAA's official max ebb of 3.4k about 20 minutes earlier, NN3D is the most inaccurate in this case, but it seems like all these developers need to check their math and/or NOAA harmonics! Then again, I don't think an experienced navigator ever expects current predictions to be very accurate. And I'll leave you with a brag that thought and this particular chart always reminds me of. Back in my youth, I several times managed to sail the Sasanoa River -- Hell Gates currents working for me -- in the 35 foot schooner Vernon Langille without electronics or auxilary propulsion, beyond two sets of big ass oars, and often with much of the enormous cockpit filled with fire wood. I do believe I also had printed tide and current tables ;-)
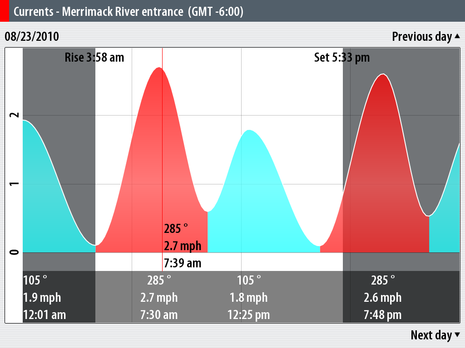
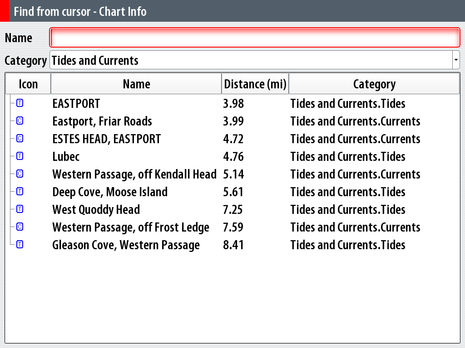
  PS: The screens below illustrate the built-in NSE graphic current predictions I missed, plus how on-chart icons can be searched:

 Share
Share
Coastal Explorer current predictions also vary from the NOAA online tables I checked, mainly high on velocity much like Garmin and Raymarine are.