
NN3D chart issues II, & some news

If you'll take a moment to read Ben's comments on Panbo, you'll understand the problem. There is data on the NOAA charts that is not on the NN3D raster chart view. There is a problem with the conversion from the Maptech format to TimeZero format.
Geez Louise! I may not have expressed myself well, but that’s not what I wrote about Furuno NavNet 3D chart issues last week. And the post above is just one of many that I think are way wide of the mark. According to some on Hull Truth the NN3D raster and vector charts for the U.S. are both useless, it was actually Navionics vectors that was shown at the boat show demos, the MFDs show less chart data than the Black Box because of video chip differences, etc. It’s mostly baloney, but Furuno USA has been paying attention to early user dissatisfaction with the vector charts. In fact, I got a call today from Camas with the news that Furuno will be selling U.S. NN3D vector charts based on Navionics data by early 2009. But let’s break that down:
Of course the Navionics vector charts will have more complete data than the NOAA S57/ENC charts that Furuno, and the rest of us, get for free. Because Navionics has painstakingly traced all the U.S. raster charts and NOAA hasn’t finished that task yet. But will the Navionics data look as familiar and good on NN3D as it does on, say, Raymarine or Northstar MFDs? I have no idea; I haven’t seen any screen shots, let alone had some solid time with a unit and the charts. And you do need to see them in action. Raster charts, which are just dumb bit maps, look like they look no matter where they’re displayed—aside from some details like anti-aliasing and where they jump scales as they zoom—but vector charts are only databases and the same data can look quite different from one display system to another, from one zoom level to another, from one user setup to another. As mentioned the other day, it’s not clear to me what NN3D vector issues are lack of data—which Furuno can’t help, except by offering commercial data—and what are due to data presentation anomalies—which Furuno can fix, and surely will. I’m really interested in seeing the NN3D charts based on Navionics data, but I make no presumptions about how they will look.
Meanwhile, what the heck is wrong with raster charts? Check out the bigger image
of NN3D above. That was real world boating, not a boatshow demo, and that screen worked even 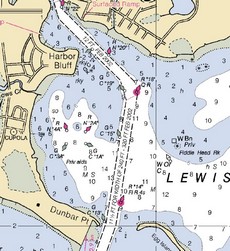 better in action than it looks in a photo, I thought. Now, as noted last week, an 8" window on that same raster would be less informative, even though this particular chart, seen right and bigger here
, is in 1:20,000 harbor scale. Even better detail is available in complex places like Woods Hole and busy ones like Miami, but most coastal coverage is limited to 1:40,000, which can look oversize like last week’s example. Rasters weren’t designed for electronic display, but they are the official charts, there’s no better data for the U.S. and many other countries, and no software can misdisplay it (much). I’ll let Hull Truth poster “Ricknav,” who knows his stuff, finish this ode to raster:
better in action than it looks in a photo, I thought. Now, as noted last week, an 8" window on that same raster would be less informative, even though this particular chart, seen right and bigger here
, is in 1:20,000 harbor scale. Even better detail is available in complex places like Woods Hole and busy ones like Miami, but most coastal coverage is limited to 1:40,000, which can look oversize like last week’s example. Rasters weren’t designed for electronic display, but they are the official charts, there’s no better data for the U.S. and many other countries, and no software can misdisplay it (much). I’ll let Hull Truth poster “Ricknav,” who knows his stuff, finish this ode to raster:
I've been following this for a while and YOU GUYS ARE NUTS! Every Official NOAA Raster Chart is loaded into every display!!! I used to charge my customers over $2000 for these exact charts with their Northstar 972 Plotters as recently as two years ago when Maptech charged a lot of money for them!! Furuno openly told me and every other dealer that the NOAA Vector library was not complete. The latest information is that it will be done in about 18 months but the rasters are done and all there.
Additionally, I still haven't seen a chart area where the Navionics or C-MAP Data is better than the original NOAA Raster Data that they copy to make their own vector charts. In fact I CHALLENGE ANYONE TO PROVE ME WRONG ON THIS ISSUE!! Show me depth information or land details that are better than the NOAA Raster Data on a Navionics or C-MAP Machine. Again, Navionics and C-MAP only copy this data. They have done no surveys of their own to improve it. If they have give the L/L and simply prove it to me.I've installed all of the leading systems including Garmin 5000/4000 and Raymarine E/G Series and they all work. However, the idea that NavNet 3D is dangerous because it includes the official NOAA Raster and Vector Libraries that Super Tankers use to navigate our waters is simply Bullsh*t! — Ricknav
You seem to be concerned about defending raster charts. I like raster charts. But with limited screen area and pixels, like an MFD8, a vector chart holds the promise of a much better display of the information that I consider relevant at a point in time.
For example a raster chart may be cluttered with TD lines which I can omit in favor of clearer depth contours. I may choose different buoy details to be emphasized in a vector chart display, or different depth shading particular to my draft. That can't be done with rasters.
Vector charts exist for a good reason. An accurate, high quality vector chart is much easier to read, and much faster to present for the display device.
High quality vector charts have existed for a long time, that's why we expect to see them on state of the art systems.
What Furuno is confirming today is that customer's expectations for charts are much higher than they thought, or than they can afford to give away. They're responding with a higher quality offering, at a higher price.